

Today’s customers crave seamless self-service experiences. They like to be in the driver’s seat and want services on their terms. That’s precisely why 92% of customers expect brands to provide a self-service portal.
It empowers them to solve problems quickly and conveniently.
The question is, Are your customers receiving the self-service experiences they expect from your brand? Are they able to address issues on their own, without resorting to time-consuming calls or emails?
There is only one answer to this question – Self-service metrics.
They allow you to keep track of the effectiveness of your self-service portal, giving you a transparent picture of the irrelevant content, poorly performing articles, or any other issue. That means you can take preventative measures and ultimately reduce customer dissatisfaction arising due to an inadequate self-service experience.
Read on to get familiar with the powerful metrics you can track to gain an unbiased and meaningful analysis of your self-service portal’s effectiveness.
Metric No 1: % of Customer Contacts via Self-Service Portal
To calculate the percentage of contacts logged directly through self-help portals, ensure that you have the technology to trace the source of a ticket or request made by a customer.
Once you have a track of the sources, you will know how exactly a customer reached out to you – via self-help options, phone, email, or social media. Requests raised via self-service can be easily monitored by:
- looking at the number of ticket forms filled from your self-service portal
- questions raised via Chat on the self-help platform.
Calculating the percentage of contacts made through self-service platforms like your knowledge base or FAQs is simple. Here is the formula:
| Number of requests raised via self-service/Total number of tickets |
|---|
Multiply the obtained figure by 100 to get the percentage.
Let’s understand this with a hypothetical example.
The total number of tickets generated across channels – social media, emails, calls, and self-service, amounts to 125. Tickets generated via self-service are only 25. To get the percentage of customer contacts made via self-service, divide 25 by 125 and multiply it by 100.
(25/125) x 100 = 20%
This means that only 20% of the customer contacts were made via your self-service platform. This low percentage is an indication that a majority of your customers find your self-service portal useful, while only a few of them couldn’t find the information they were looking for.
| 💡Improvement Tip: Work on the quality of your self-help platform. Keep it information-rich and fluff-free. Demonstrate the use of a product and explain concepts using videos and screenshots to maximize customer engagement. Add related topics at the end of an article so that customers can quickly switch to a relevant article that has what they are looking for. |
|---|
Here’s an example of a help center that makes excellent use of images, videos, and related articles.
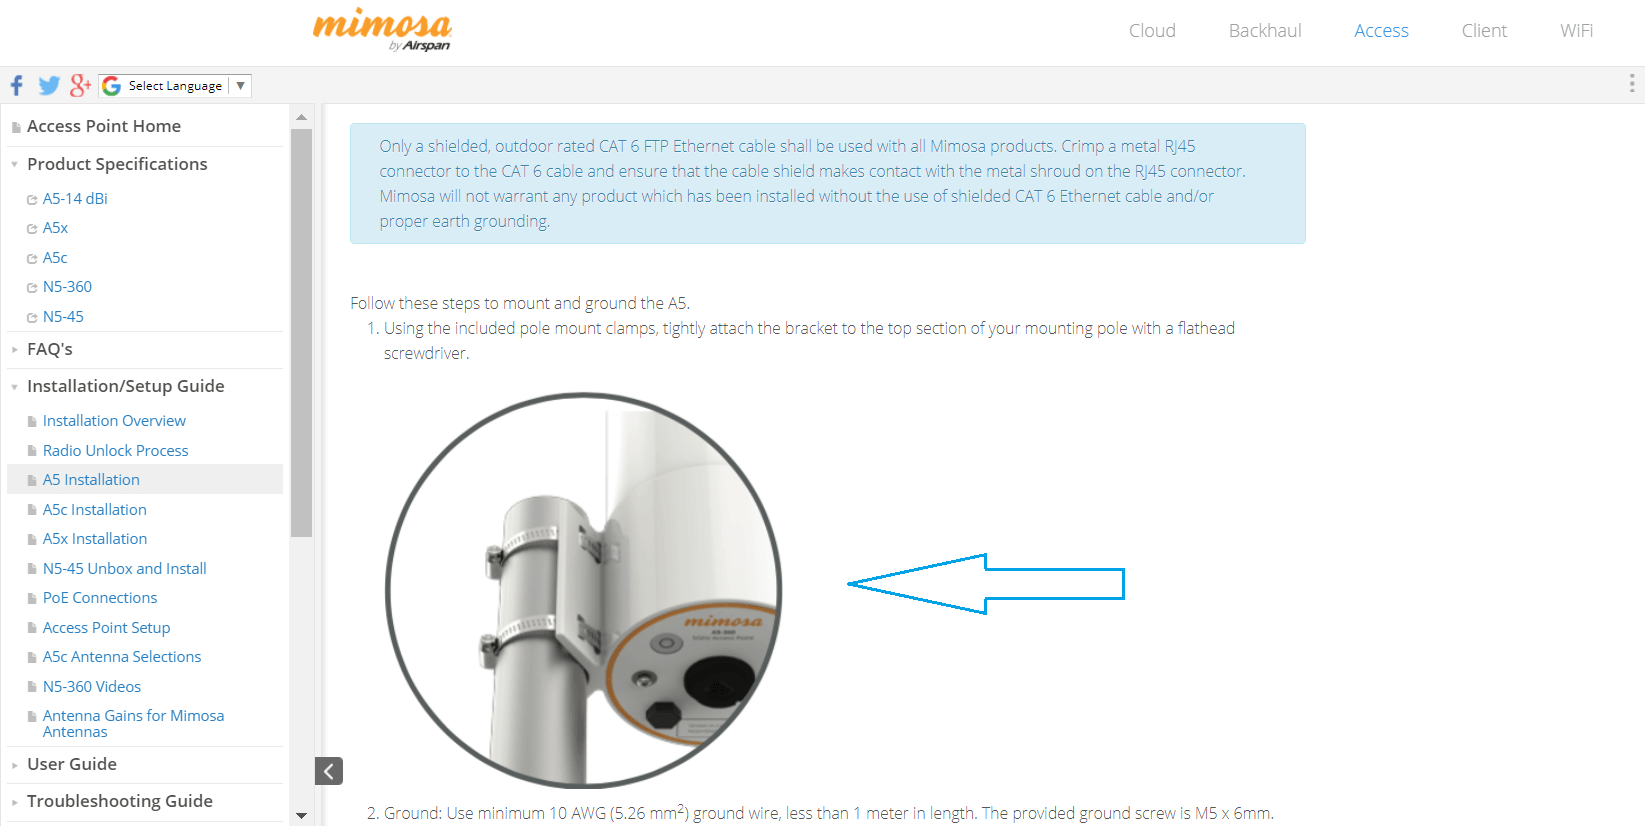
Steps in a process are demonstrated using images, as you can see above.
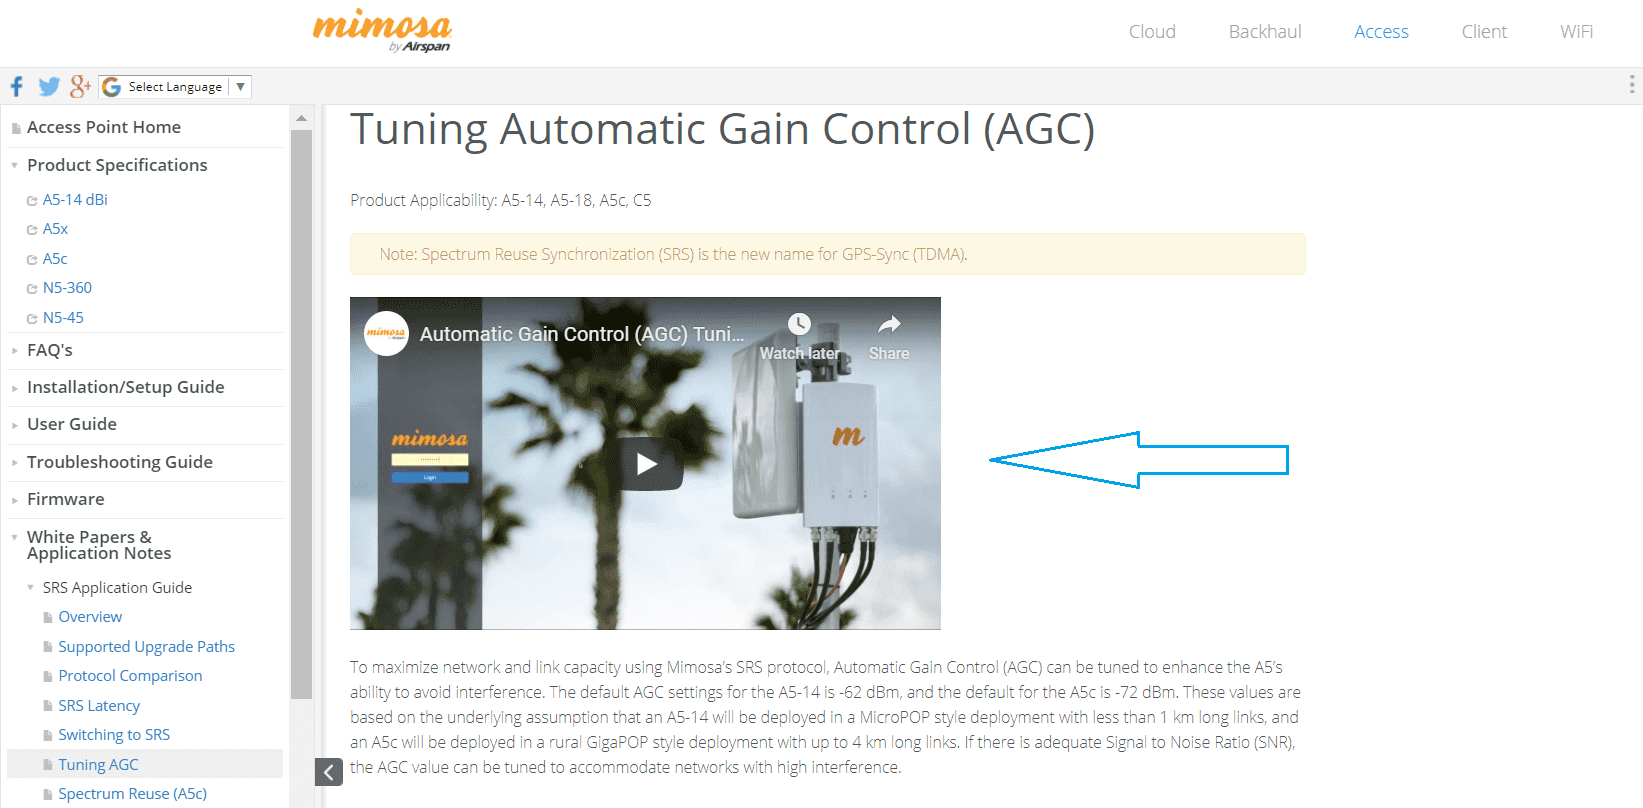
A video right at the beginning of the topic to capture customer’s attention.
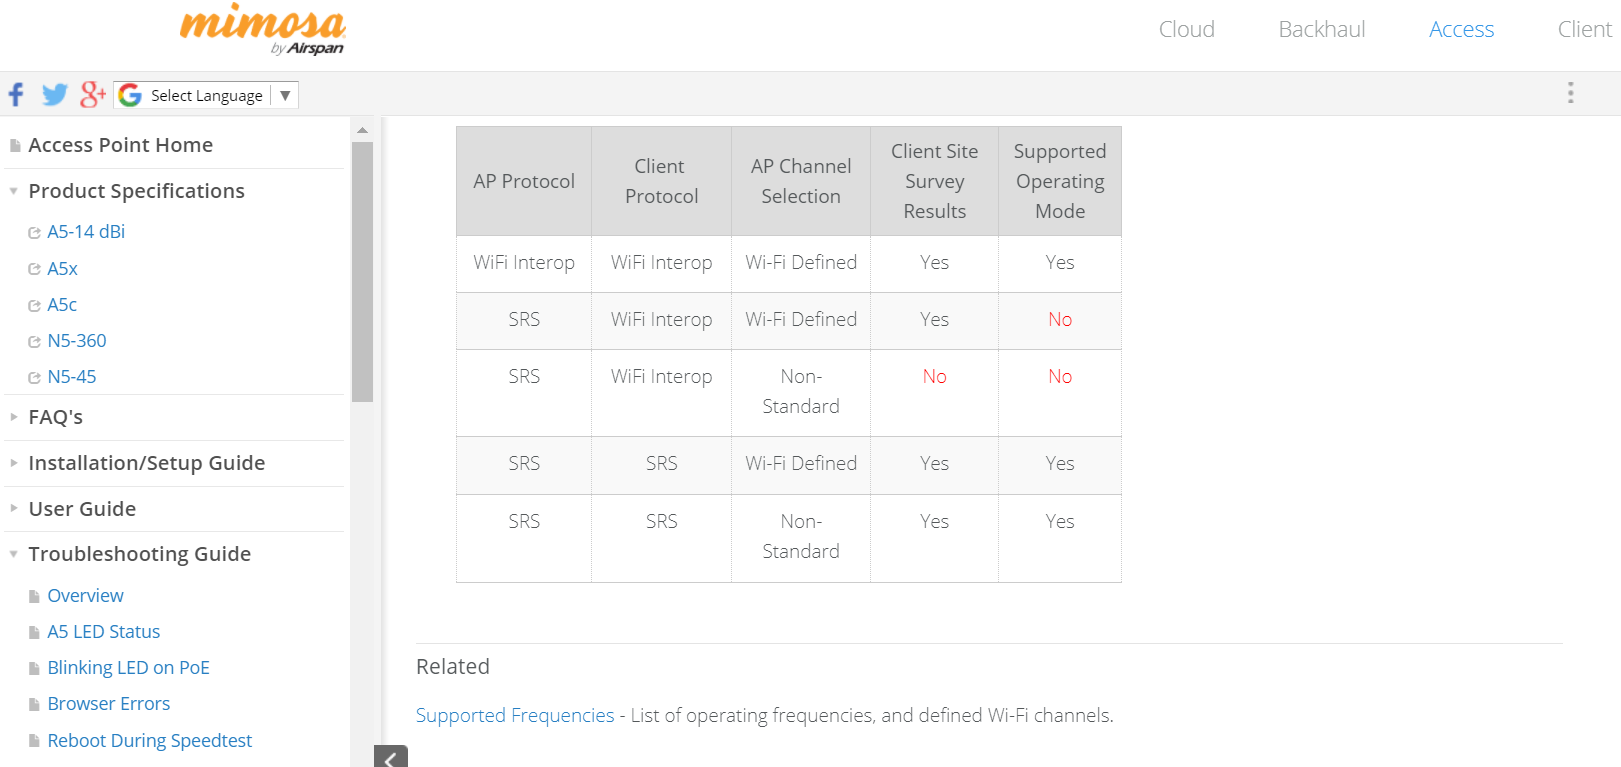
Image Sources: Mimosa help center
Can you see a small section at the bottom of the page? That’s where the help center adds related articles. As you scroll down, you will find that this ‘Related Articles’ section is added on every page.
Metric No. 2: Overall Self-Help Portal Performance
This is a broader metric that covers various elements such as:
- Most read articles
- Popular and poorly rated articles
- Failed searches
- Broken links
All of these combined can give you an in-depth assessment of your self-help knowledge base.
This treasure trove of data can be easily obtained if your knowledge base tool has a built-in reporting mechanism. This data provides a sneak-peek into the performance of your self-help portal. Leverage them to spot knowledge gaps, poorly performing articles, keywords that failed to yield results, and much more.
For example, the failed searches report provides an indication of the questions people are searching for but not finding answers. If the number of failed searches keeps declining over time, it indicates that your self-help portal is performing well. This report helps you decide what new articles to add or how to tag existing articles that are there but not getting found.
| 💡 Improvement Tip: Add new self-help articles on keywords that your customers search frequently. Update existing articles in case they lack valuable information. Add relevant keywords to articles to make them search-friendly. |
|---|
Here’s a short video to help you understand how tracking this metric can substantially improve your self-service.
Explore: 30 Customer Service Metrics & KPIs to Track in 2020
Metric No. 3: Self-Help Portal’s Customer Satisfaction Score & Net Promoter Score
Launching customer satisfaction surveys on the self-help portal is a sure-fire way to understand how happy customers are with your self-service. To get the right inputs, create multiple surveys related to the ease of use of your portal, overall customer satisfaction, and content relevance.
Ask questions such as:
- How will you rate your experience on a scale of 1 to 5?
Options: 1. Extremely Good 2. Good 3. Neutral 4. Poor 5. Very Poor
- How satisfied are you with the information provided?
Options: 1. Very Satisfied, 2. Satisfied, 3. Neutral,4. Somewhat Dissatisfied, 5. Extremely Dissatisfied
You can also create Net Promoter Score surveys to measure customer satisfaction and loyalty. It’s a single-question survey – “How likely are you to recommend our company to a colleague or friend?”, with 1 to 10 as the answer options.
It’s a great way to get a deeper understanding of how satisfied customers are with your brand. For example, ProProfs does something similar. It launches NPS surveys every six months to check the pulse of customer delight.
| 💡 Improvement Tip: Lengthy survey questions are a turnoff for customers. Try creating short and succinct surveys – exactly what customers need while they are busy browsing your self-help portal. |
|---|
Also Read: Self-Service Customer Support - Everything You Need to Know
Metric No. 4: Number of Support Calls
The call volume will automatically experience a sharp drop if your self-service platform performs well on the above-mentioned metrics.
If this happens, it’s a clear indication of:
- Higher adoption and effectiveness of your self-service system
- A decrease in the workload of your support staff
- The support team has the time to focus on other pressing customer issues
On the contrary, if your call volume continues to climb steadily, consider that your self-service platform needs a significant improvement.
| 💡 Improvement Tip: Your self-help knowledge base shouldn’t simply be a compilation of basic information. Whether you are a product firm or a service delivery company, ensure that your self-help portal comprises the why and the how-to. This will substantially minimize the chances of customers calling your agents, even for more complex issues. |
|---|
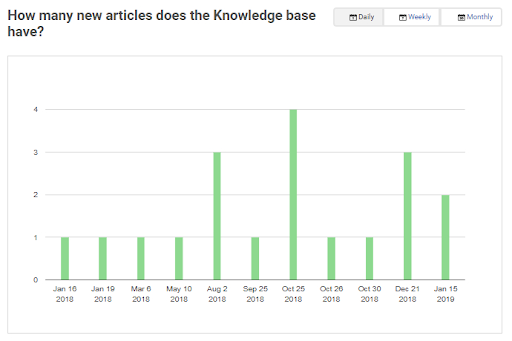
Metric No. 5: Content Relevance
One major determinant of your self-service platform’s success is whether or not it is scaling and evolving with changing customer expectations.
Creating a self-service platform is not a one-time activity. It has to be kept updated with new content that customers are searching for, which means:
- more new articles
- more modifications
- removal of obsolete content
If no new content is being created or modified, it signals that your self-service platform isn’t doing well. But if you see new content being constantly generated, new pages created, and alterations in existing content, trust that your self-service platform is doing a kick-ass job.
| 💡 Improvement Tip: Assign the role of content auditing to a few members of your customer support staff. They should keep track of obsolete content and ensure that it’s updated from time to time. |
|---|
Watch: How to Analyze Your Knowledge Base Reports
Metric No. 6: Bounce Rate
The bounce rate gives you a clear picture of the effectiveness of your knowledge base. In simple terms, it represents the percentage of people visiting your knowledge base and leaving abruptly without going deeper into it.
A website’s bounce rate is majorly between 26% to 70%. The bounce rate varies from industry to industry. For instance, if you have a retail website, the bounce rate can be anywhere between 20 to 40%, while if you run a self-service portal, it can fall between 10 to 30%.
Your goal should ideally be to concentrate on keeping your portal’s bounce rate as low as possible.
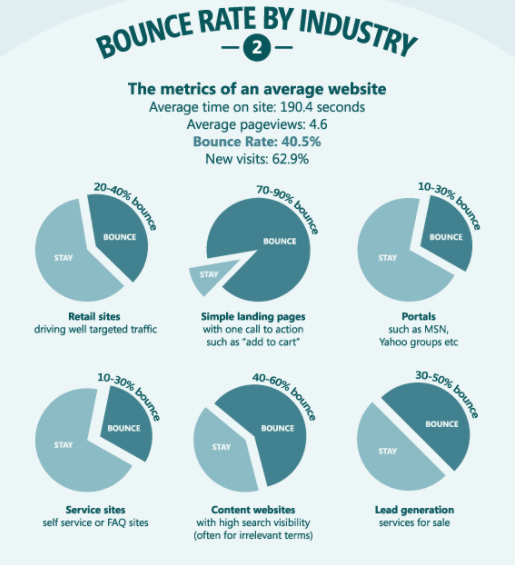 Image Source: Crazyegg
A lower bounce rate = high customer engagement and satisfaction
&
A higher bounce rate = low customer engagement and satisfaction
Tracking bounce rate is a cakewalk if your knowledge base tool integrates with Google Analytics. It uses benchmarking to provide you insights into the average bounce rate of your portal, visitor analysis, and much more depending on the industry it belongs to.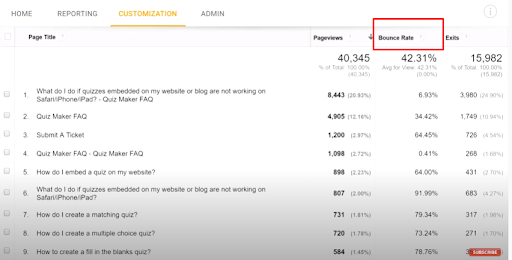 Here’s how it works-
💡Improvement Tip: Bounce rate can be improved significantly by taking a few simple measures such as:
|
|---|
Here is an example of HighQ’s self-service portal. It has a prominent search bar, great structure, simple language, and short, crisp paragraphs.
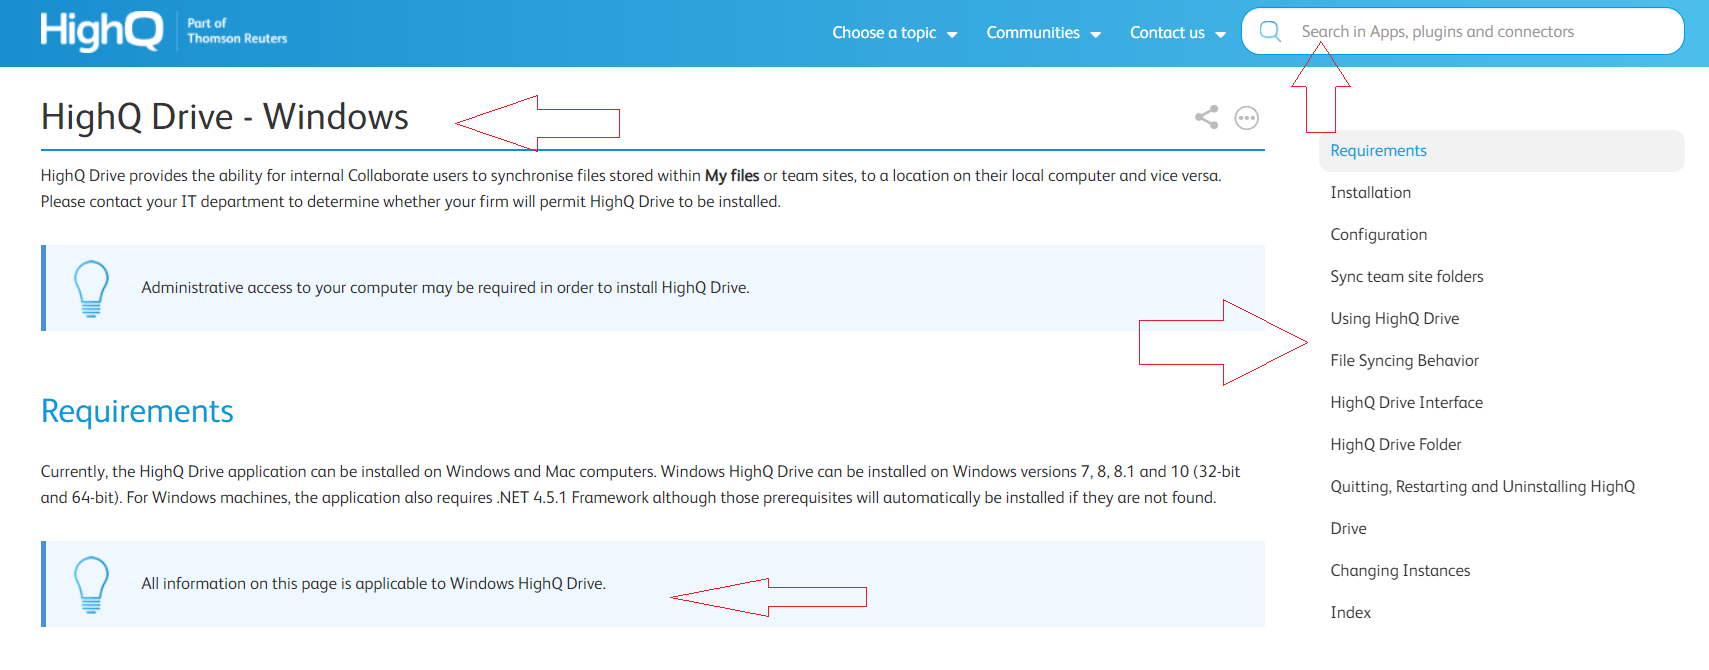
Image Source: HighQ
Take Your Self-Service Portal to The Next Level
While various companies have realized the importance of embracing their self-service portal, only a few are doing it successfully. Hop on to the bandwagon of these few companies by regularly monitoring the performance of your self-help platform.
Track metrics such as customer contacts made via self-service, bounce rate, content relevance, and call volume trends to evaluate the effectiveness of your portal.
Once you’ve identified challenging areas, improving your self-service performance will be a breeze.
Focus on the quality of self-service content, searchability of your platform, structure, and various other things discussed above. Do these little things right, and be consistent in your efforts to take your self-service platform to the next level.
If you need more information on how to assess your self-service success, feel free to reach out to us at our toll-free contact number (855) 776-7763. We will be happy to assist you.
FREE. All Features. FOREVER!
Try our Forever FREE account with all premium features!